Concrete Industry Statistics
The headline concrete industry statistics: US producers delivered an estimated 377 million cubic yards of ready-mixed concrete in 2024, the world made about 3.8 billion metric tons of cement in 2025, and cement production causes around 7 percent of global CO2 emissions. Every figure below names its data year and links to the agency or trade body that published it. Last checked November 10, 2026.
Key concrete statistics at a glance
Eight numbers that sum up the industry. Each is sourced in its section below.
US ready-mix, 2024
377 million yd³
Estimated ready-mixed concrete production, down about 5.7 percent from 2023 (NRMCA).
World cement, 2025
3.8 billion t
Metric tons of cement produced worldwide. China made about 45 percent of it (USGS).
World concrete
14 billion m³
Concrete produced each year, about 18.3 billion cubic yards (GCCA, 2021).
Average price, 2023
$159.68 / yd³
Average ready-mix selling price reported by producers, up from $122.98 in 2021 (NRMCA).
Price index since 2020
+41%
Rise in the BLS ready-mix producer price index from January 2020 to September 2026.
Concrete finishers, 2025
204,800
Cement masons and concrete finishers employed in the US, at a median $27.41 an hour (BLS via O*NET).
Share of global CO2
About 7%
Cement production's share of global CO2 emissions (GCCA).
Per American, 2024
1.1 yd³
Ready-mix produced per US resident, roughly 2.2 tons each. Our calculation from NRMCA and Census data.
US ready-mixed concrete production
US ready-mixed concrete production was an estimated 377 million cubic yards in 2024, about 5.7 percent below 2023, according to the National Ready Mixed Concrete Association (NRMCA). That is 18 percent under the 2005 peak.
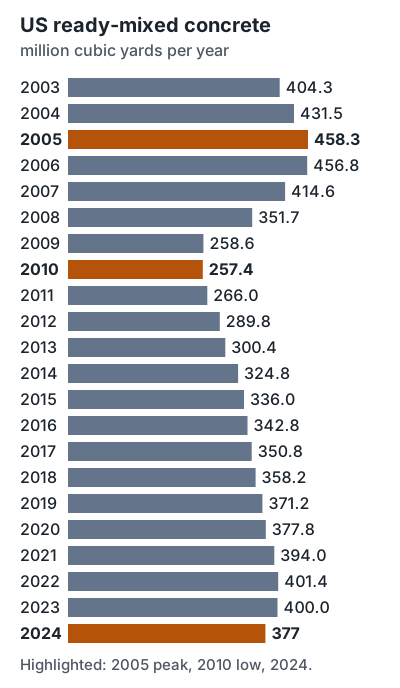
- Peak: 458.3 million cubic yards in 2005, per NRMCA's state of the industry report.
- Low: 257.4 million in 2010, a 44 percent fall in five years.
- Recovery: production took until 2022 to pass 400 million again (401.4 million), then held at 400.0 million in 2023.
- 2025 so far: 245 million cubic yards from January through August, about 3.4 percent behind the same months of 2024, per NRMCA's August 2025 update.
The same NRMCA report estimates the industry at about 7,500 concrete plants and 70,000 mixer trucks making roughly 50 million round-trip deliveries a year. At 400 million cubic yards, that works out to about 8 cubic yards a load, which matches how many yards a concrete truck holds.
NRMCA does not count trucks at the gate. It estimates national production from the cement shipments reported to the US Geological Survey, so these are estimates, not a census.
Spread across the 340.0 million US residents the Census Bureau estimated for July 1, 2024, 377 million cubic yards is 1.1 cubic yards per person. At 4,050 pounds a yard, the figure our concrete weight calculator uses for reinforced concrete, that is about 2.2 tons for every American.
US cement statistics
The US produced an estimated 84 million metric tons of cement in 2025 and consumed about 110 million, with imports covering 21 percent of consumption, according to the USGS Mineral Commodity Summaries 2026.
| Measure | 2021 | 2022 | 2023 | 2024 | 2025 |
|---|---|---|---|---|---|
| Production | 91.0 | 91.2 | 89.7 | 85 | 84 |
| Apparent consumption | 111 | 114 | 113 | 110 | 110 |
| Cement imports | 19.9 | 25.0 | 25.0 | 23.7 | 23 |
| Net import reliance | 19% | 22% | 22% | 22% | 21% |
| Mill price, $ per metric ton | $127 | $139 | $152 | $160 | $160 |
| Mine and mill jobs | 12,300 | 12,800 | 13,000 | 13,000 | 13,000 |
More from the same USGS summary:
- Plants: 97 cement plants in 34 states and Puerto Rico.
- Leading states: Texas, Missouri, California and Florida make about 44 percent of US cement.
- Sales: about 100 million metric tons shipped in 2025, worth an estimated $17 billion.
- Customers: 70 to 75 percent of cement goes to ready-mixed concrete producers, 11 percent to concrete product makers and 8 to 10 percent to contractors.
- Import sources, 2021 to 2024: Turkey 32 percent, Canada 20 percent, Vietnam 13 percent, Greece 9 percent.
- Blended cement: 63 percent of shipments in the first nine months of 2025, and about 95 percent of that was Type IL portland-limestone cement.
US consumption of 110 million metric tons across 341.8 million residents is about 710 pounds of cement per person in 2025 (our calculation). Cement is only one ingredient, usually 10 to 15 percent of the mix by volume; see how concrete is made.
World cement and concrete production
The world produced about 3.8 billion metric tons of cement in 2025, down from 3.9 billion in 2024, and China made 1.7 billion of it, about 45 percent, per the USGS. India was second at 470 million metric tons, about 12 percent.
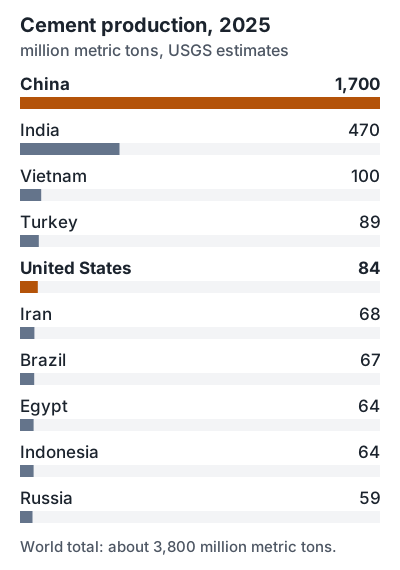
- The United States ranked fifth at 84 million metric tons, about 2 percent of world output.
- China's production fell from 1.8 billion metric tons in 2024 to 1.7 billion in 2025; India's rose from 440 million to 470 million.
- Vietnam (100 million) and Turkey (89 million) both out-produced the US.
For concrete itself, the Global Cement and Concrete Association (GCCA) puts world production at about 14 billion cubic meters a year and calls concrete the most widely used material on earth after water. The figure dates from GCCA's October 2021 roadmap.
We left out "global concrete market size" dollar figures. They come from paid market research reports that disagree with each other and do not publish their methods.
Concrete price statistics
Ready-mix producers reported an average selling price of $159.68 per cubic yard in 2023, up from $137.99 in 2022 and $122.98 in 2021, a 30 percent rise in two years. The figures come from NRMCA's Performance Benchmarking Survey, whose 174 participants delivered 33 percent of US ready-mix that year.
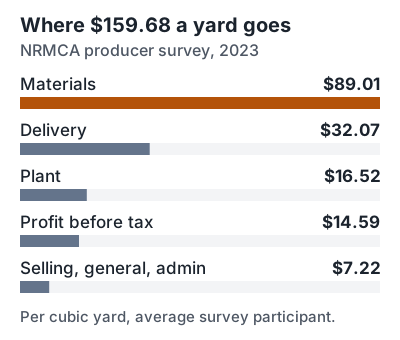
- Materials cost producers $89.01 a yard in 2023, about 56 percent of the selling price.
- Delivery cost $32.07 a yard, about 20 percent. The average round trip was 28 miles.
- Profit before tax was $14.59 a yard, which NRMCA called a record per yard, or 9.1 percent of sales.
For prices since 2023, the best public measure is the Bureau of Labor Statistics Producer Price Index for ready-mix concrete manufacturing. It stood at 402.8 in September 2026 (June 1981 = 100).
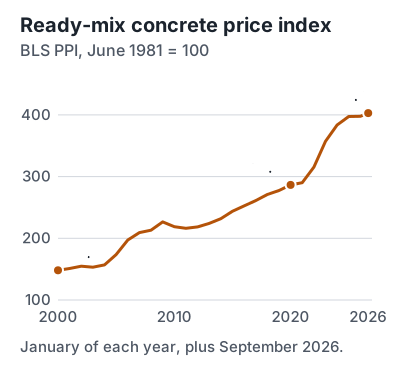
- Up 41 percent since January 2020 (286.5 to 402.8).
- Up 2.3 percent in the 12 months to September 2026, so the 2021 to 2023 surge has cooled without reversing.
- About 2.7 times its January 2000 level of 148.2.
Cement followed the same path: the average US mill price rose from $127 per metric ton in 2021 to an estimated $160 in 2025, up 26 percent (USGS). To price a specific pour, use the concrete cost calculator or read concrete cost per cubic yard.
Sand, gravel and crushed stone statistics
The US produced about 870 million metric tons of construction sand and gravel and 1.5 billion metric tons of crushed stone in 2025, per the USGS. Aggregate is 60 to 75 percent of a concrete mix by volume.
Construction sand and gravel, 2025
870 million t
Worth about $12.6 billion at $14.50 a metric ton, from roughly 3,400 companies and 6,500 pits in all 50 states.
42 percent went into portland cement concrete as aggregate. USGS sand and gravel summary.
Crushed stone, 2025
1.5 billion t
Worth about $27 billion at $18.50 a metric ton, from about 1,400 companies and 3,500 quarries.
72 percent was construction aggregate and 17 percent went to cement manufacturing. USGS crushed stone summary.
Prices rose faster than volumes: sand and gravel went from $10.52 a metric ton in 2021 to $14.50 in 2025 (up 38 percent), and crushed stone from $13.26 to $18.50 (up 40 percent). For a project quantity, see the gravel calculator.
Concrete industry jobs and wages
About 204,800 people worked as cement masons and concrete finishers in the US in 2025, earning a median $27.41 an hour or $57,020 a year, according to Bureau of Labor Statistics data published on O*NET OnLine.
| Percentile | Hourly | Annual |
|---|---|---|
| 10th | $18.84 | $39,190 |
| 25th | $22.60 | $47,010 |
| Median | $27.41 | $57,020 |
| 75th | $32.15 | $66,870 |
| 90th | $41.10 | $85,480 |
- Outlook: employment is projected to grow 1 to 2 percent from 2025 to 2035, slower than average (O*NET).
- Ready-mix plants: ready-mix concrete manufacturing employed 108,700 people in 2025, per the BLS industry productivity series. The peak was 130,600 in 2006 and the low was 82,400 in 2011.
- Cement plants: about 13,000 mine and mill workers in 2025 (USGS).
- Aggregates: about 71,200 quarry and mill workers in crushed stone and 41,900 in construction sand and gravel in 2025 (USGS).
Construction demand statistics
US construction spending totaled $2.164 trillion in 2025, down 1.4 percent from $2.195 trillion in 2024, according to the Census Bureau's construction spending release. Concrete demand follows that spending.
Private residential
$905.2 billion
2025, down 2.6 percent.
Private nonresidential
$742.4 billion
2025, down 3.1 percent.
Public construction
$516.8 billion
2025, up 3.6 percent.
Highway and street
$141.9 billion
2025, down 0.9 percent, a change within the survey's margin of error.
Builders started about 1.36 million homes in 2025, nearly level with 2024, but single-family starts fell about 7 percent to roughly 941,000, per the Census Bureau's new residential construction data. Single-family homes drive demand for foundations, slabs and driveways.
Concrete and cement CO2 emissions statistics
Cement production accounts for around 7 percent of global CO2 emissions, according to the GCCA. Emissions data is published for cement, the binder in concrete, not for concrete as a whole.
Process emissions, 2025
About 1.5 Gt CO2
Released worldwide when limestone breaks down in the kiln, per the Global Carbon Project cement dataset (Andrew, May 2026).
Kiln fuel, 2025
About 0.9 Gt CO2
Extra emissions from burning fossil fuel for kiln heat, from the same dataset. Together that is about 2.4 billion metric tons.
US cement plants, 2023
65.6 million t CO2e
Reported by 91 cement facilities to the EPA Greenhouse Gas Reporting Program, down from 68.6 million in 2022.
- US cement plant emissions were 55.5 million metric tons CO2e in 2011, so the 2023 figure is 10.1 million higher (EPA).
- GCCA said in 2021 that producers had cut emissions by a fifth since 1990, and committed to a further 25 percent cut by 2030 on the way to net zero by 2050.
- In the US, the American Cement Association's Roadmap to Carbon Neutrality, introduced in 2021, targets a carbon-neutral industry by 2050.
- The switch to blended cement is the most visible change so far: 63 percent of US cement shipments in the first nine months of 2025 (USGS).
Concrete recycling and quality statistics
The US generated 600 million tons of construction and demolition debris in 2018, more than twice the amount of municipal solid waste, and just over 455 million tons of it (76 percent) went to a next use instead of a landfill, according to the EPA. Concrete is one of the main materials in that stream.
- Demolition produced more than 90 percent of the debris; new construction less than 10 percent.
- Aggregate was the largest next use, at about 313 million tons in EPA's material-specific data. That is where most crushed concrete ends up; see the crushed concrete calculator.
- Just under 145 million tons went to landfills.
On quality, NRMCA's 2025 quality benchmark report covers 49 producers and 52.2 million cubic yards:
- The average specified strength was 3,897 psi. Our concrete psi guide explains what each strength is used for.
- Concrete rejected at the jobsite was 0.68 percent of production, up from 0.31 percent a year earlier.
- Another 1.3 percent was lost to internal quality problems before delivery.
Concrete by scale: the Hoover Dam yardstick
Hoover Dam contains 3.25 million cubic yards of concrete, or 4.36 million counting the power plant and other works, according to the Bureau of Reclamation. At the 2024 rate, the US ready-mix industry produces that much about every four days, or roughly 86 Hoover Dams a year (our calculation).
- The Bureau says the concrete would pave a 16-foot-wide highway from San Francisco to New York City.
- Crews placed it between June 6, 1933 and May 29, 1935, peaking at 10,462 cubic yards in one day.
- More than 582 miles of 1-inch steel pipe carried ice water through the concrete to cool it as it cured.
- The project used more than 5 million barrels of cement.
How these statistics were compiled
Every figure on this page comes from a government agency, a trade association's own published data, or a peer-reviewed dataset, and is linked in the sentence that uses it. We opened each source on November 10, 2026 and copied the numbers from the source itself.
- Units: USGS and emissions figures are in metric tons (2,205 pounds). EPA debris figures are in US short tons (2,000 pounds). Concrete volumes are in cubic yards unless marked cubic meters.
- Estimates: USGS marks its 2024 and 2025 cement figures as estimates, and NRMCA's production totals are estimated from cement shipments.
- Our calculations: percentages of change, per-person figures, the yards-per-load figure and the Hoover Dam comparison are our arithmetic on the sourced numbers, and each is labeled.
- Data years differ: the newest full-year ready-mix total is 2024, the newest producer price survey is 2023 and the newest EPA debris estimate is 2018. Each number states its year.
You are welcome to quote these figures or reuse the charts with a link to this page as the source. To turn any of this into a number for your own project, start with the concrete calculator.
Frequently asked questions
How much concrete is produced in the US each year?
About 377 million cubic yards of ready-mixed concrete in 2024, according to the National Ready Mixed Concrete Association, which estimates the total from cement shipments. That is down from 400 million in 2023 and below the record 458.3 million set in 2005.
How much concrete does the world use each year?
About 14 billion cubic meters, or roughly 18.3 billion cubic yards, according to the Global Cement and Concrete Association. The cement that goes into it totaled about 3.8 billion metric tons in 2025, per the US Geological Survey.
Which country produces the most cement?
China, with an estimated 1.7 billion metric tons in 2025, about 45 percent of the world total. India is second at 470 million metric tons, followed by Vietnam, Turkey and the United States, which made 84 million metric tons (USGS Mineral Commodity Summaries 2026).
How much CO2 does concrete produce?
Cement production accounts for around 7 percent of global CO2 emissions, according to the Global Cement and Concrete Association. The Global Carbon Project cement dataset puts 2025 process emissions at about 1.5 billion metric tons of CO2, plus about 0.9 billion from kiln fuel.
What is the average price of ready-mix concrete?
Producers reported an average selling price of $159.68 per cubic yard in 2023 in the NRMCA Performance Benchmarking Survey, up from $122.98 in 2021. The BLS producer price index for ready-mix concrete has risen about 41 percent since January 2020.
How many people work in the concrete industry?
About 204,800 people worked as cement masons and concrete finishers in the US in 2025, at a median wage of $27.41 an hour. Ready-mix concrete manufacturing employed another 108,700, and cement plants about 13,000, based on BLS and USGS data.